How is school quality currently being measured and what is important to my family?
Here at Show Me KC Schools, we do not rank schools.
Our mission is to provide you with all the information you need to make a well informed decision about your students’ education. Here are some data points that the Missouri Department of Elementary and Secondary Education (DESE) collects on all public schools that can also be found when you select a school from the School Search feed.
With this information, you can begin to build your picture of quality and what is important to your family.

School Quality Metrics
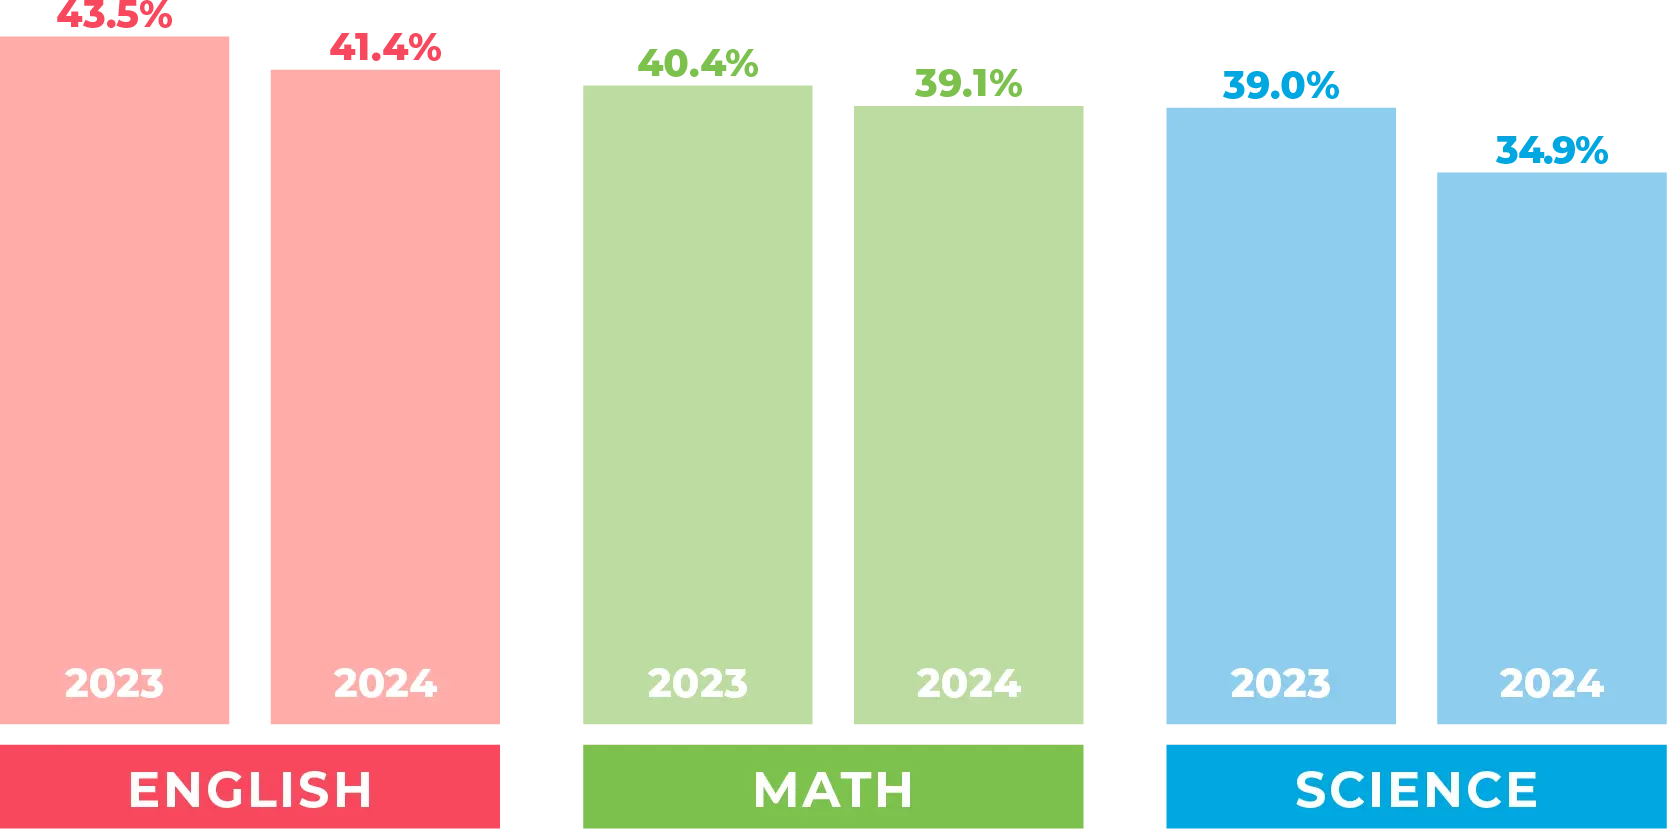
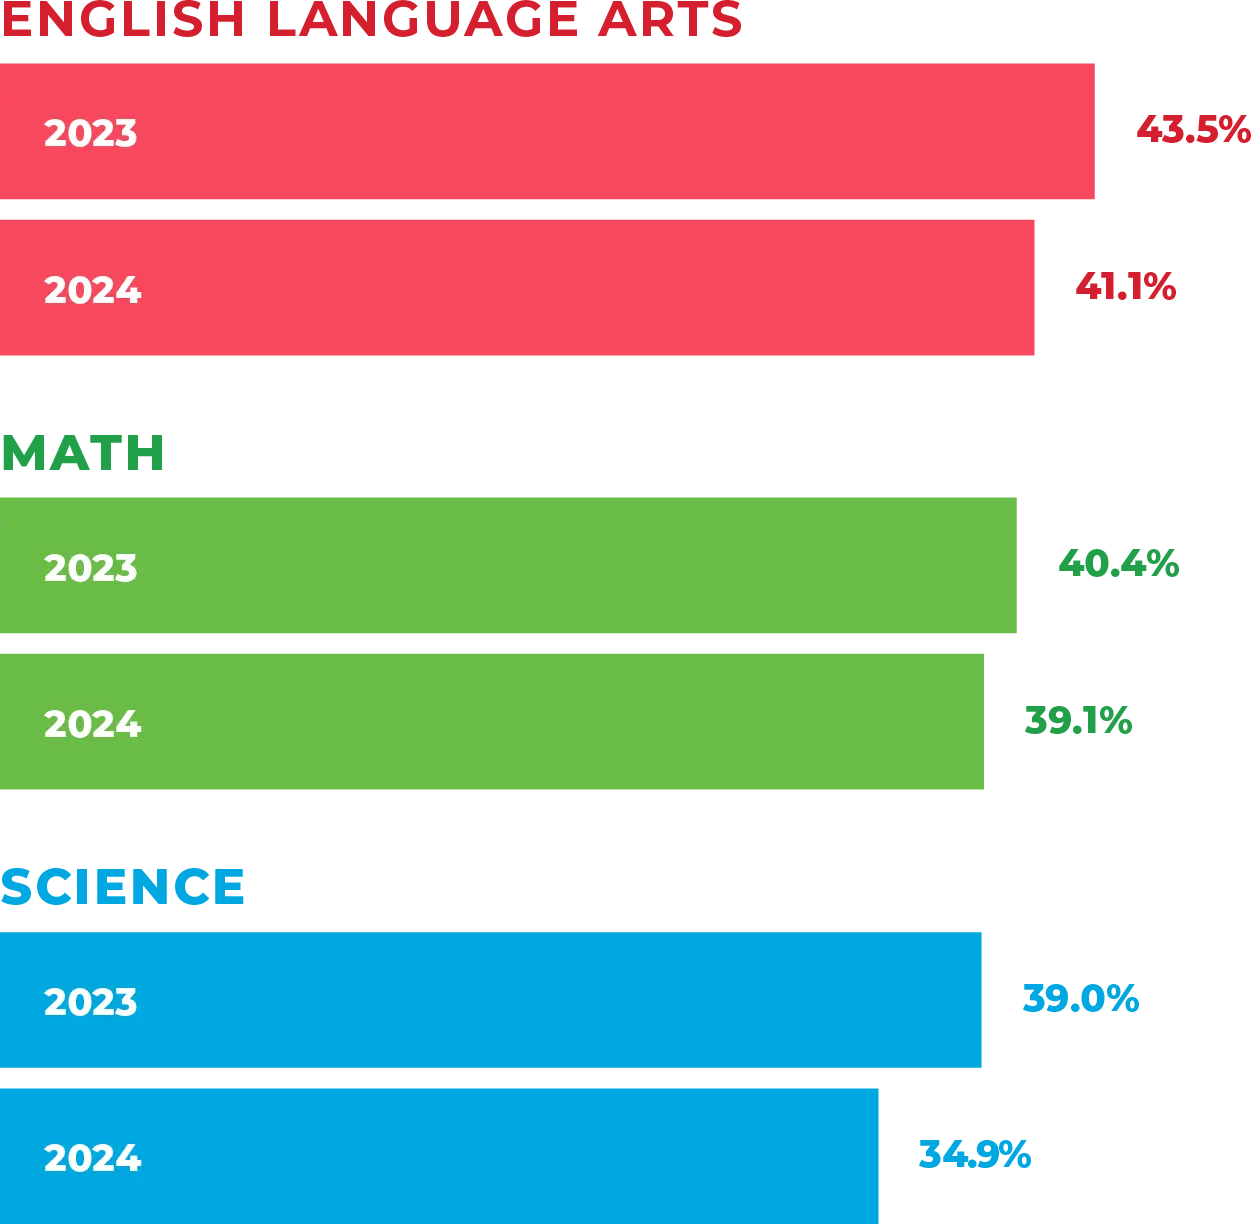
MAP (Missouri Assessment Program) scores are a set of tests that are given to students once a year in the subjects of Math, English, and Science. The MAP assessments test students’ progress toward mastery of the Missouri Show-Me Standards.
The graph shows the percentage of students who tested proficient or advanced in the state of Missouri for the last two school years. You may chose to use these numbers to establish a baseline for a schools performance.
SUBGROUP MAP SCORES:
MAP scores for smaller group populations broken out by; race and ethnicity, socio-economics, Special Education students, and English language learners. If your student belongs to one or more of these subgroups, you may want to compare these scores to see how schools you are interested in are serving all students.
The average daily attendance rate at a school. This measures percentage of students present 90% of the school year.
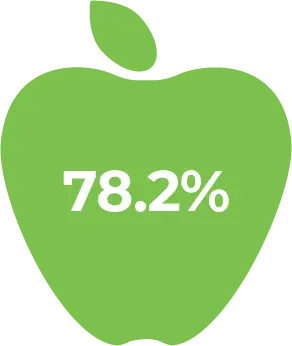
In 2024, 78.2% of all Missouri students were in attendance at least 90% of the time.
The percentage of students that are on a four-year trajectory for graduation.
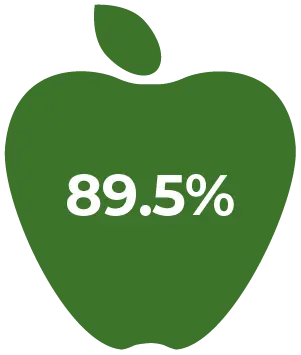
In 2024, 89.5% of Missouri students graduated in 4 years.
Measures the percentage of students who are reading on grade level by the third grade. (Third grades scores are important because it is the final year children are learning to read, after which students are reading to learn. If they are not proficient readers when they begin fourth grade, as much as half of the curriculum they will be taught will be difficult to comprehend.)

In 2024, the average 3rd grade reading score in Missouri was 41.6%.
Student growth is the change in academic achievement (as measured by the grade-level Missouri Assessment Program exams in English language arts and mathematics) for an individual student between two or more points in time. The Missouri Growth Model calculates how much students “grew” relative to predictions.

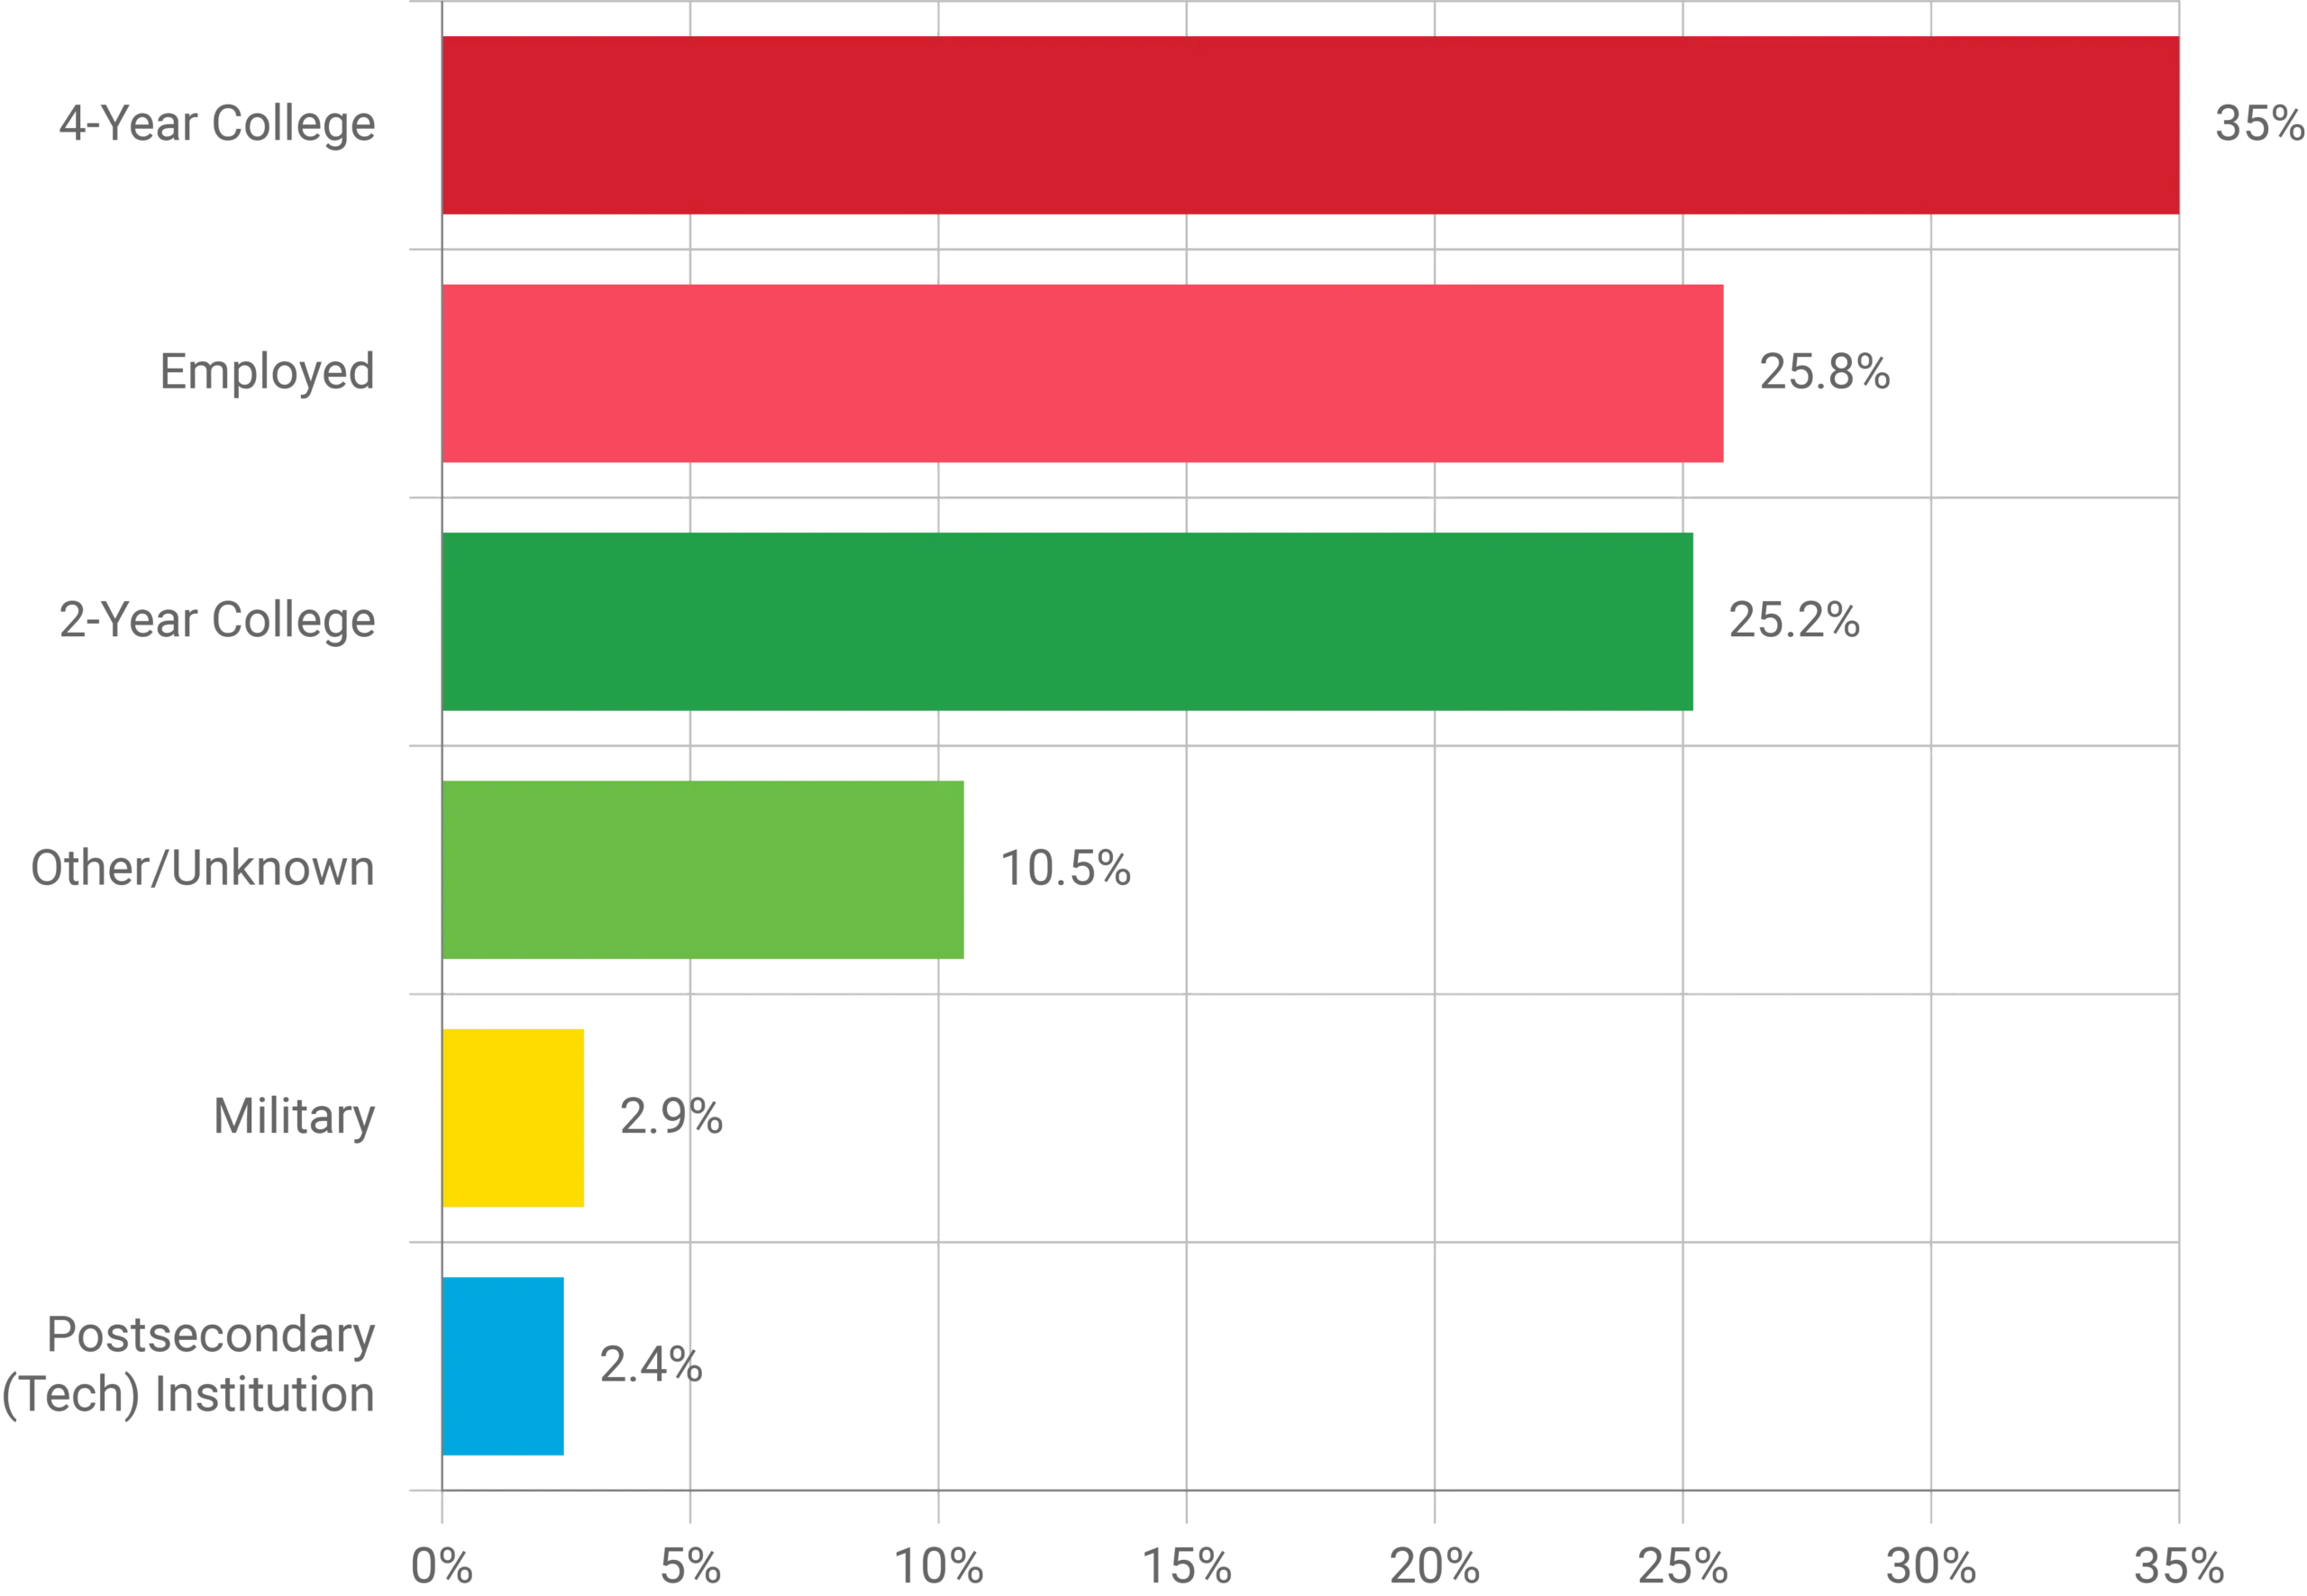
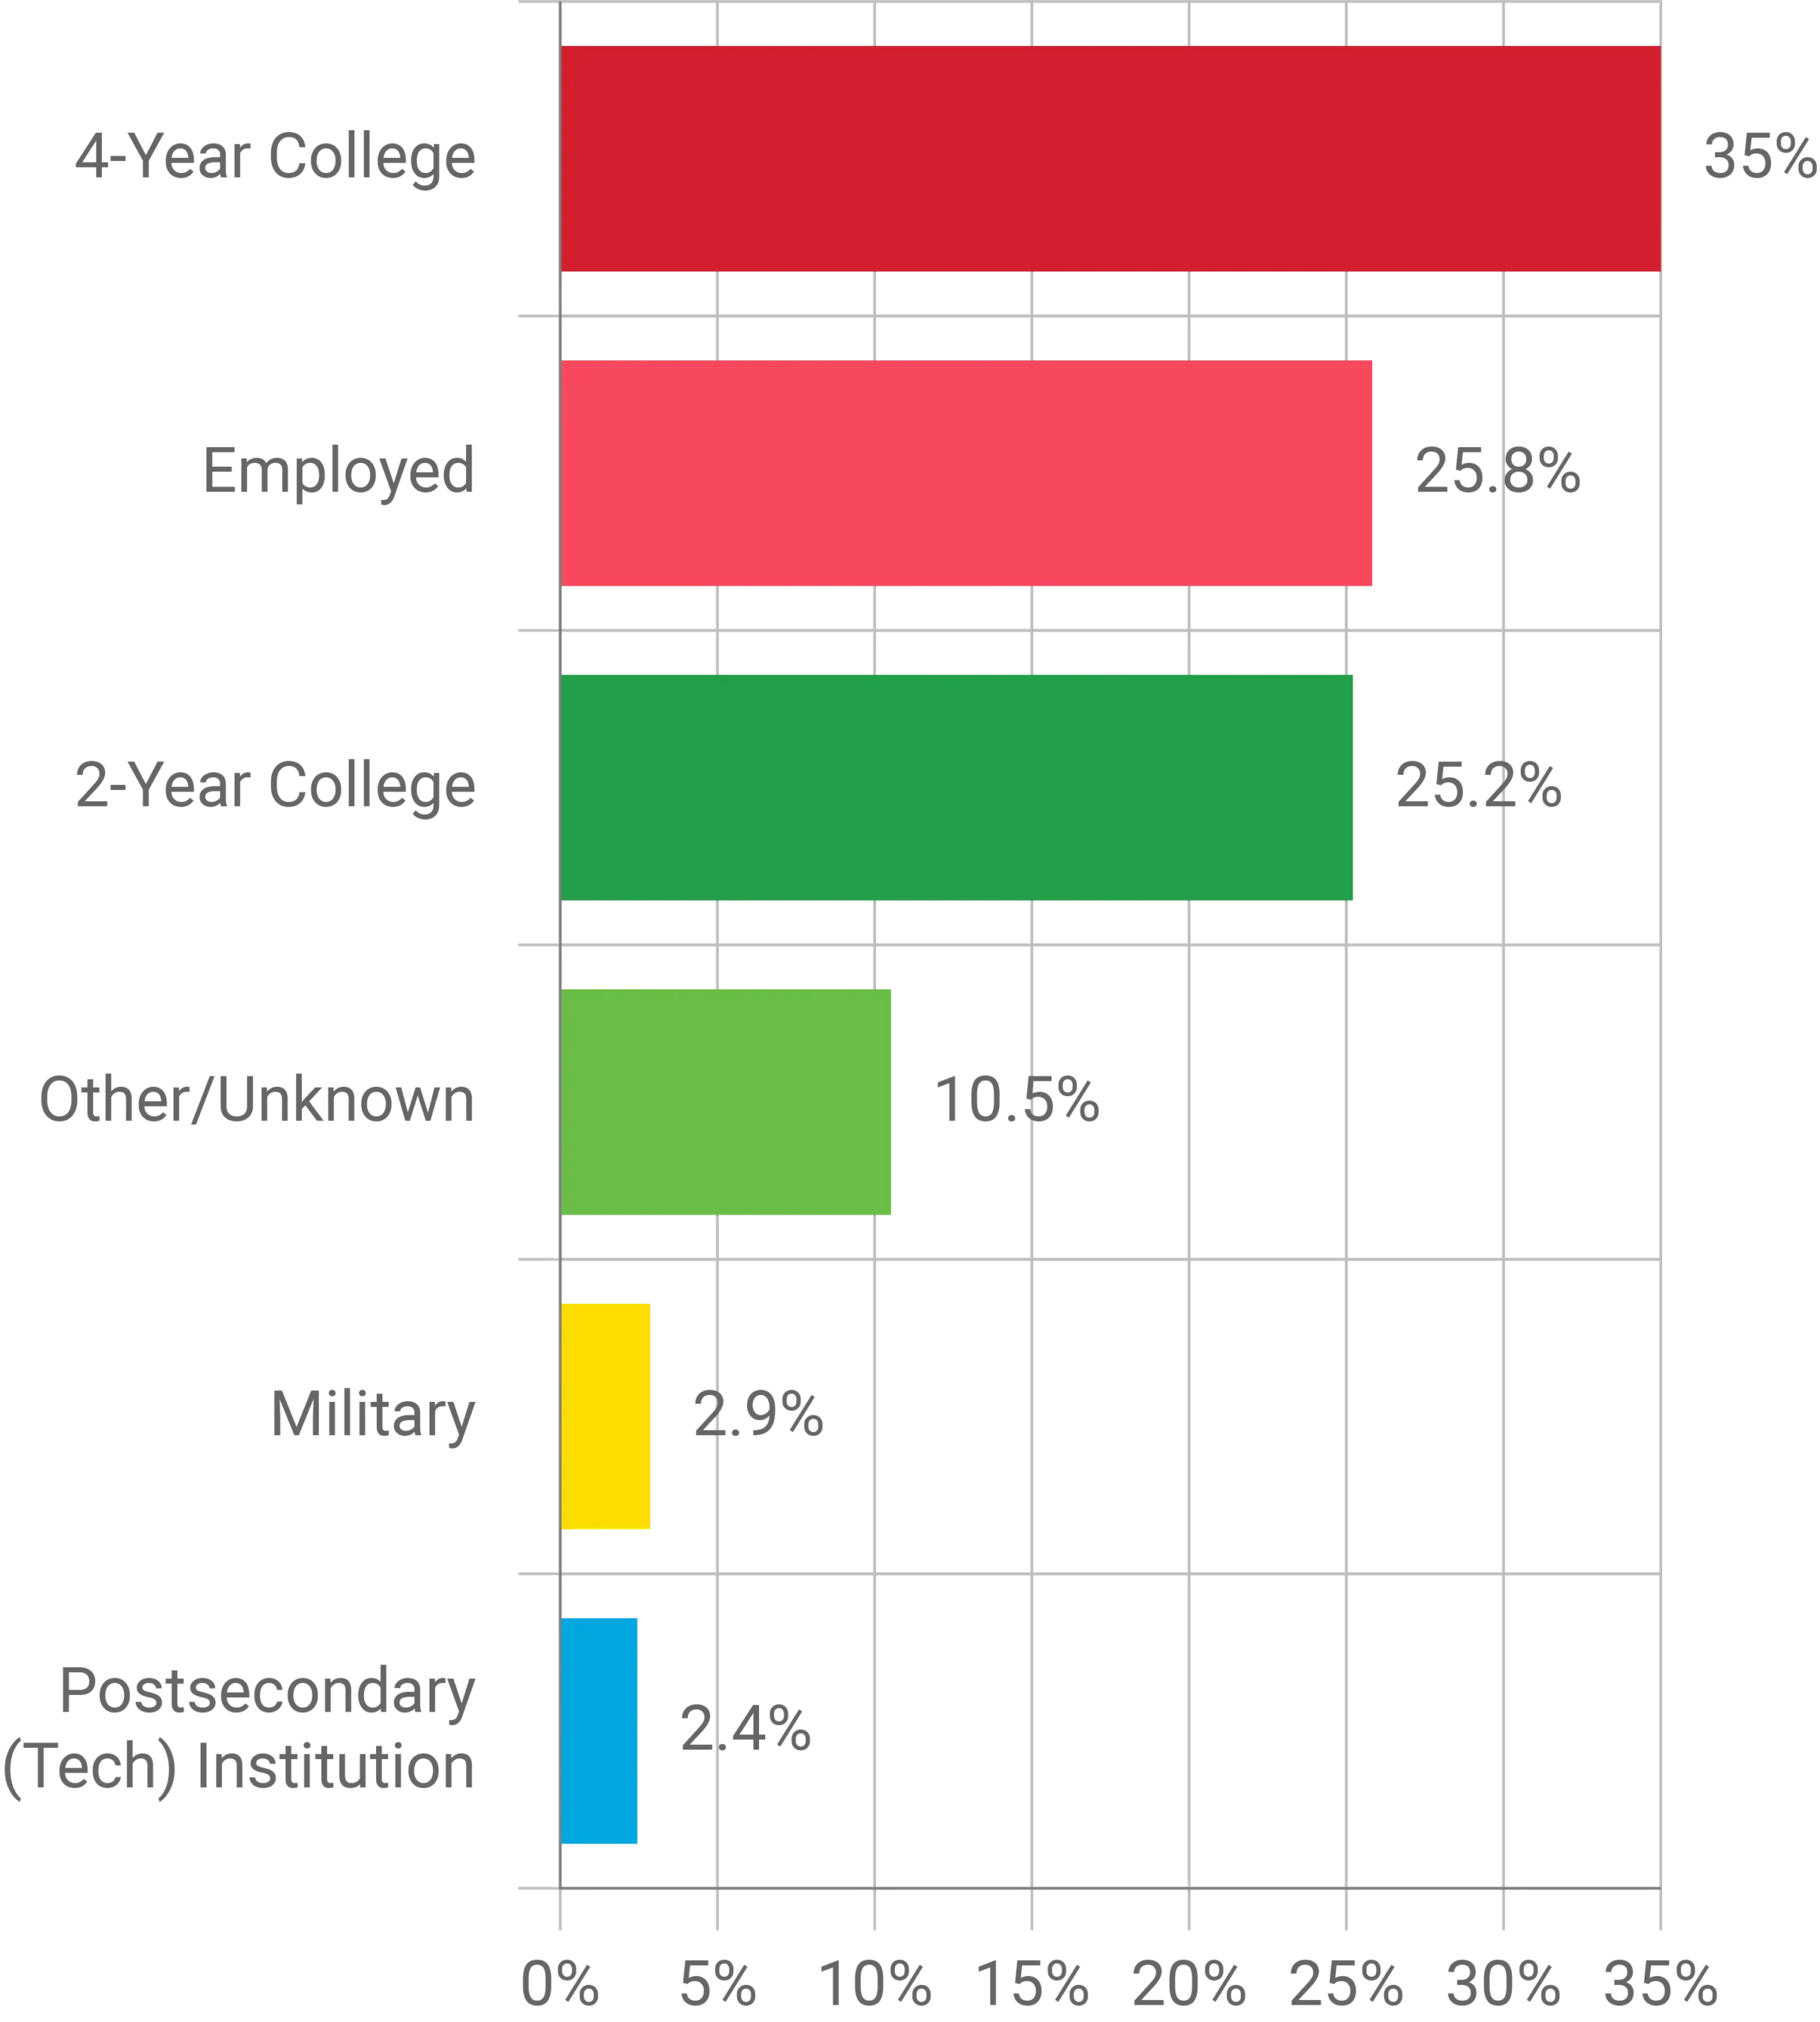
This measures the percentage of graduates who are college or career ready, percentage of graduates who have earned advanced or vocational credits, or percentage of graduates who are employed, in the military or are seeking further education six months after graduation.
Family Logistics
Every family chooses a school for different reasons. We know that logistics is one of the most important factors to consider when choosing a school. How does this school fit into your family’s daily routine? Do you need transportation? Does the school offer before and after care? Is breakfast served? These things matter as much as a test score. Consider them carefully when making a decision.